


The scope of environmental data reporting covers a total of 63 companies, including the Company and its consolidated subsidiaries. The above serves as the basic rule, and any exceptions are described in the main text.
For further details, please refer to the following link.
-
 Subsidiaries and affiliates
(73KB)
Subsidiaries and affiliates
(73KB)
Approximately 99% of the Group’s major production sites have established and operate environmental management systems (EMS) that comply with ISO 14001 and Eco Action 21 (EA21). Among these, roughly 81% have obtained third-party certifications such as ISO 14001.
(Unit : Sites)
|
Certifications |
Domestic |
Overseas |
|
ISO 14001 |
30 |
15 |
|
Eco-Action 21 |
9 |
0 |
|
Green Management Certification |
1 |
0 |
|
Subtotal |
40 |
15 |
|
Total |
55 |
|
|
Unit |
FY2020 |
FY2021 |
FY2022 |
FY2023 |
FY2024 |
|||
|
INPUT |
Total energy input |
PJ |
17.6 |
18.3 |
17.9 |
17.4 |
17.3 |
|
|
Fossil fuel consumption |
Thousand kL |
110.3 |
115.5 |
110.7 |
114.6 |
117.5 |
||
|
Biomass fuel consumption |
MJ |
64.7 |
200.3 |
64.2 |
35.4 |
137.6 |
||
|
Purchased electric power |
GWh |
1,304.8 |
1,358.7 |
1,334.2 |
1,278.8 |
1,263.9 |
||
|
Thermal power generation |
GWh |
1.4 |
1.4 |
1.0 |
1.1 |
0.9 |
||
|
Biomass power generation |
MWh |
- |
69.0 |
180.7 |
241.0 |
287.0 |
||
|
Hydroelectric power generation |
GWh |
74.7 |
72.8 |
68.8 |
61.9 |
41.8 |
||
|
Solar power generation |
MWh |
347.4 |
1,522.2 |
1,841.8 |
2,675.0 |
3,780.0 |
||
|
Water resources |
Million m3 |
100.3 |
102.6 |
100.6 |
99.7 |
94.9 |
||
|
Seawater |
Million m3 |
87.6 |
89.6 |
88.5 |
87.0 |
83.0 |
||
|
Besides seawater |
Million m3 |
12.7 |
13.1 |
12.1 |
12.8 |
11.9 |
||
|
Waste water received |
Million m3 |
0.8 |
0.9 |
|||||
|
Waste water from processes |
Million m3 |
0.1 |
0.1 |
|||||
|
Mine water (total of waste water from collection stations and mine water) |
Million m3 |
0.7 |
0.8 |
|||||
|
Raw material use |
Thousand tons |
954.1 |
1,065.0 |
1,050.5 |
952.2 |
939.3 |
||
|
Raw materials |
Thousand tons |
714.6 |
807.1 |
785.0 |
698.1 |
707.2 |
||
|
Sub-materials |
Thousand tons |
161.0 |
167.6 |
180.7 |
152.6 |
142.2 |
||
|
Heat treatment of items received |
Thousand tons |
77.2 |
88.8 |
83.5 |
100.1 |
88.5 |
||
|
Packaging materials |
Thousand tons |
1.3 |
1.5 |
1.2 |
1.4 |
1.5 |
||
|
Amount of waste received |
Thousand tons |
1,449.2 |
1,613.2 |
1,677.4 |
1,720.2 |
1,726.0 |
||
|
Waste |
Thousand tons |
1,313.4 |
1,478.7 |
1,557.9 |
1,613.3 |
1,613.5 |
||
|
Statutory recycled items received |
Thousand tons |
97.5 |
94.0 |
89.5 |
92.1 |
88.2 |
||
|
Contaminated soil |
Thousand tons |
37.7 |
39.6 |
29.1 |
13.8 |
23.4 |
||
|
Fluorocarbon throughput |
tons |
603.5 |
778.6 |
916.5 |
953.7 |
913.5 |
||
|
Unit |
FY2020 |
FY2021 |
FY2022 |
FY2023 |
FY2024 |
||
|
Within business areas |
Waste heat power generation |
GWh |
80.3 |
97.7 |
86.6 |
76.7 |
69.8 |
|
Waste heat utilization |
TJ |
1,035.7 |
1,634.1 |
1,502.0 |
2,218.9 |
2,123.2 |
|
|
Recycled water |
Thousand m3 |
741.7 |
771.9 |
900.8 |
852.2 |
777.9 |
|
|
Unit |
FY2020 |
FY2021 |
FY2022 |
FY2023 |
FY2024 |
|||||
|
OUTPUT |
Total greenhouse gas emissions |
Thousand tons-CO2 |
1,756.0 |
1,698.7 |
1,679.2 |
1,645.9 |
1,386.8 |
|||
|
Electric power source |
Thousand tons-CO2 |
681.3 |
637.5 |
658.7 |
623.6 |
544.8 |
||||
|
Fossil fuel source |
Thousand tons-CO2 |
312.5 |
324.5 |
311.0 |
322.0 |
324.1 |
||||
|
Waste source |
Thousand tons-CO2 |
762.2 |
736.8 |
709.5 |
700.3 |
517.9 |
||||
|
Amount of electric energy sold |
GWh |
1.3 |
1.8 |
3.0 |
3.9 |
5.1 |
||||
|
Product quantity |
Thousand tons |
885.9 |
965.0 |
927.9 |
902.6 |
917.0 |
||||
|
Chemical substance emissions |
tons |
1,541.0 |
1,489.0 |
1,526.3 |
2,160.2 |
1,399.3 |
||||
|
Drainage water discharge |
Million m3 |
114.1 |
100.2 |
99.2 |
98.2 |
93.3 |
||||
|
Seawater |
Million m3 |
87.6 |
89.6 |
88.5 |
87.0 |
83.0 |
||||
|
Excluding seawater |
Million m3 |
26.5 |
10.6 |
10.7 |
11.2 |
10.3 |
||||
|
Recycling and waste amount |
Thousand tons |
1,178.6 |
1,130.0 |
1,109.6 |
1,336.3 |
1,354.7 |
||||
|
Recycled amount |
Thousand tons |
761.3 |
735.5 |
721.1 |
932.9 |
971.1 |
||||
|
Thermal recycling |
Thousand tons |
425.3 |
430.1 |
426.8 |
656.1 |
675.2 |
||||
|
inside the Group |
Thousand tons |
340.3 |
343.8 |
342.5 |
476.3 |
474.7 |
||||
|
outside the Group |
Thousand tons |
85.0 |
86.4 |
84.3 |
179.8 |
200.5 |
||||
|
Material recycling |
Thousand tons |
336.0 |
305.4 |
294.4 |
276.8 |
295.9 |
||||
|
inside the Group |
Thousand tons |
244.9 |
212.0 |
195.3 |
163.0 |
203.3 |
||||
|
outside the Group |
Thousand tons |
91.1 |
93.4 |
99.0 |
113.8 |
92.5 |
||||
|
Waste generated |
Thousand tons |
417.3 |
394.4 |
388.4 |
403.4 |
383.6 |
||||
Note:
- With regard to CO2 emissions, in principle the DOWA Group seeks to multiply amounts of electricity purchased, fossil fuel consumed, and waste received by the emission factor put forth in the Law Concerning the Promotion of Measures to Cope with Global Warming.
- Regarding CO2 emissions derived from waste received, because the calculation terms are as of the time this report was prepared, numbers may not necessarily match those reported to government agencies, which are calculated at a different time.
- Due to differences in the classification of waste in Japan and overseas and to the difficulty in setting an appropriate emission factor for waste received at overseas business sites, only the portion of CO2 emissions originating from waste from domestic business locations is given.
- The CO2 emission factor that has been used for domestic electricity thus far was the unadjusted providerspecific factor for the greenhouse gas calculation, reporting, and announcement system in accordance with the Act on Promotion of Global Warming Countermeasures (formerly the basic emissions factor). However, with the change in the system, this was changed to the provider-specific basic emissions factor (formerly the adjusted emissions factor). In line with this, we have recalculated emissions using the adjusted emissions factor, backdating to fiscal 2013, the baseline year for our reduction targets.
-
Figures for prior years may have been revised.
(Unit : Sites)
|
Management Objectives Based on Agreements with Local Governments |
More Stringent Self‑Imposed Management Goals |
|
|
Atmosphere |
5 |
13 |
|
Water |
6 |
19 |
(Unit:tons)
|
Item |
FY2020 |
FY2021 |
FY2022 |
FY2023 |
FY2024 |
|
HCI |
19 |
34 |
31 |
28 |
16 |
|
NOx |
439 |
480 |
530 |
595 |
576 |
|
SOx |
163 |
124 |
150 |
177 |
175 |
|
Particulate Matter |
39 |
33 |
25 |
24 |
24 |
(Unit : tons)
|
Item |
FY2020 |
FY2021 |
FY2022 |
FY2023 |
FY2024 |
|
COD |
360 |
423 |
221 |
178 |
159 |
|
BOD |
66 |
50 |
51 |
68 |
76 |
The amount of water resources used in FY2024 was 94.9 million m³, a 4.8% decrease from the previous year. Freshwater use amounted to 11.9 million m³, representing slightly over 10% of total water use, and decreased by 6.6% year on year.
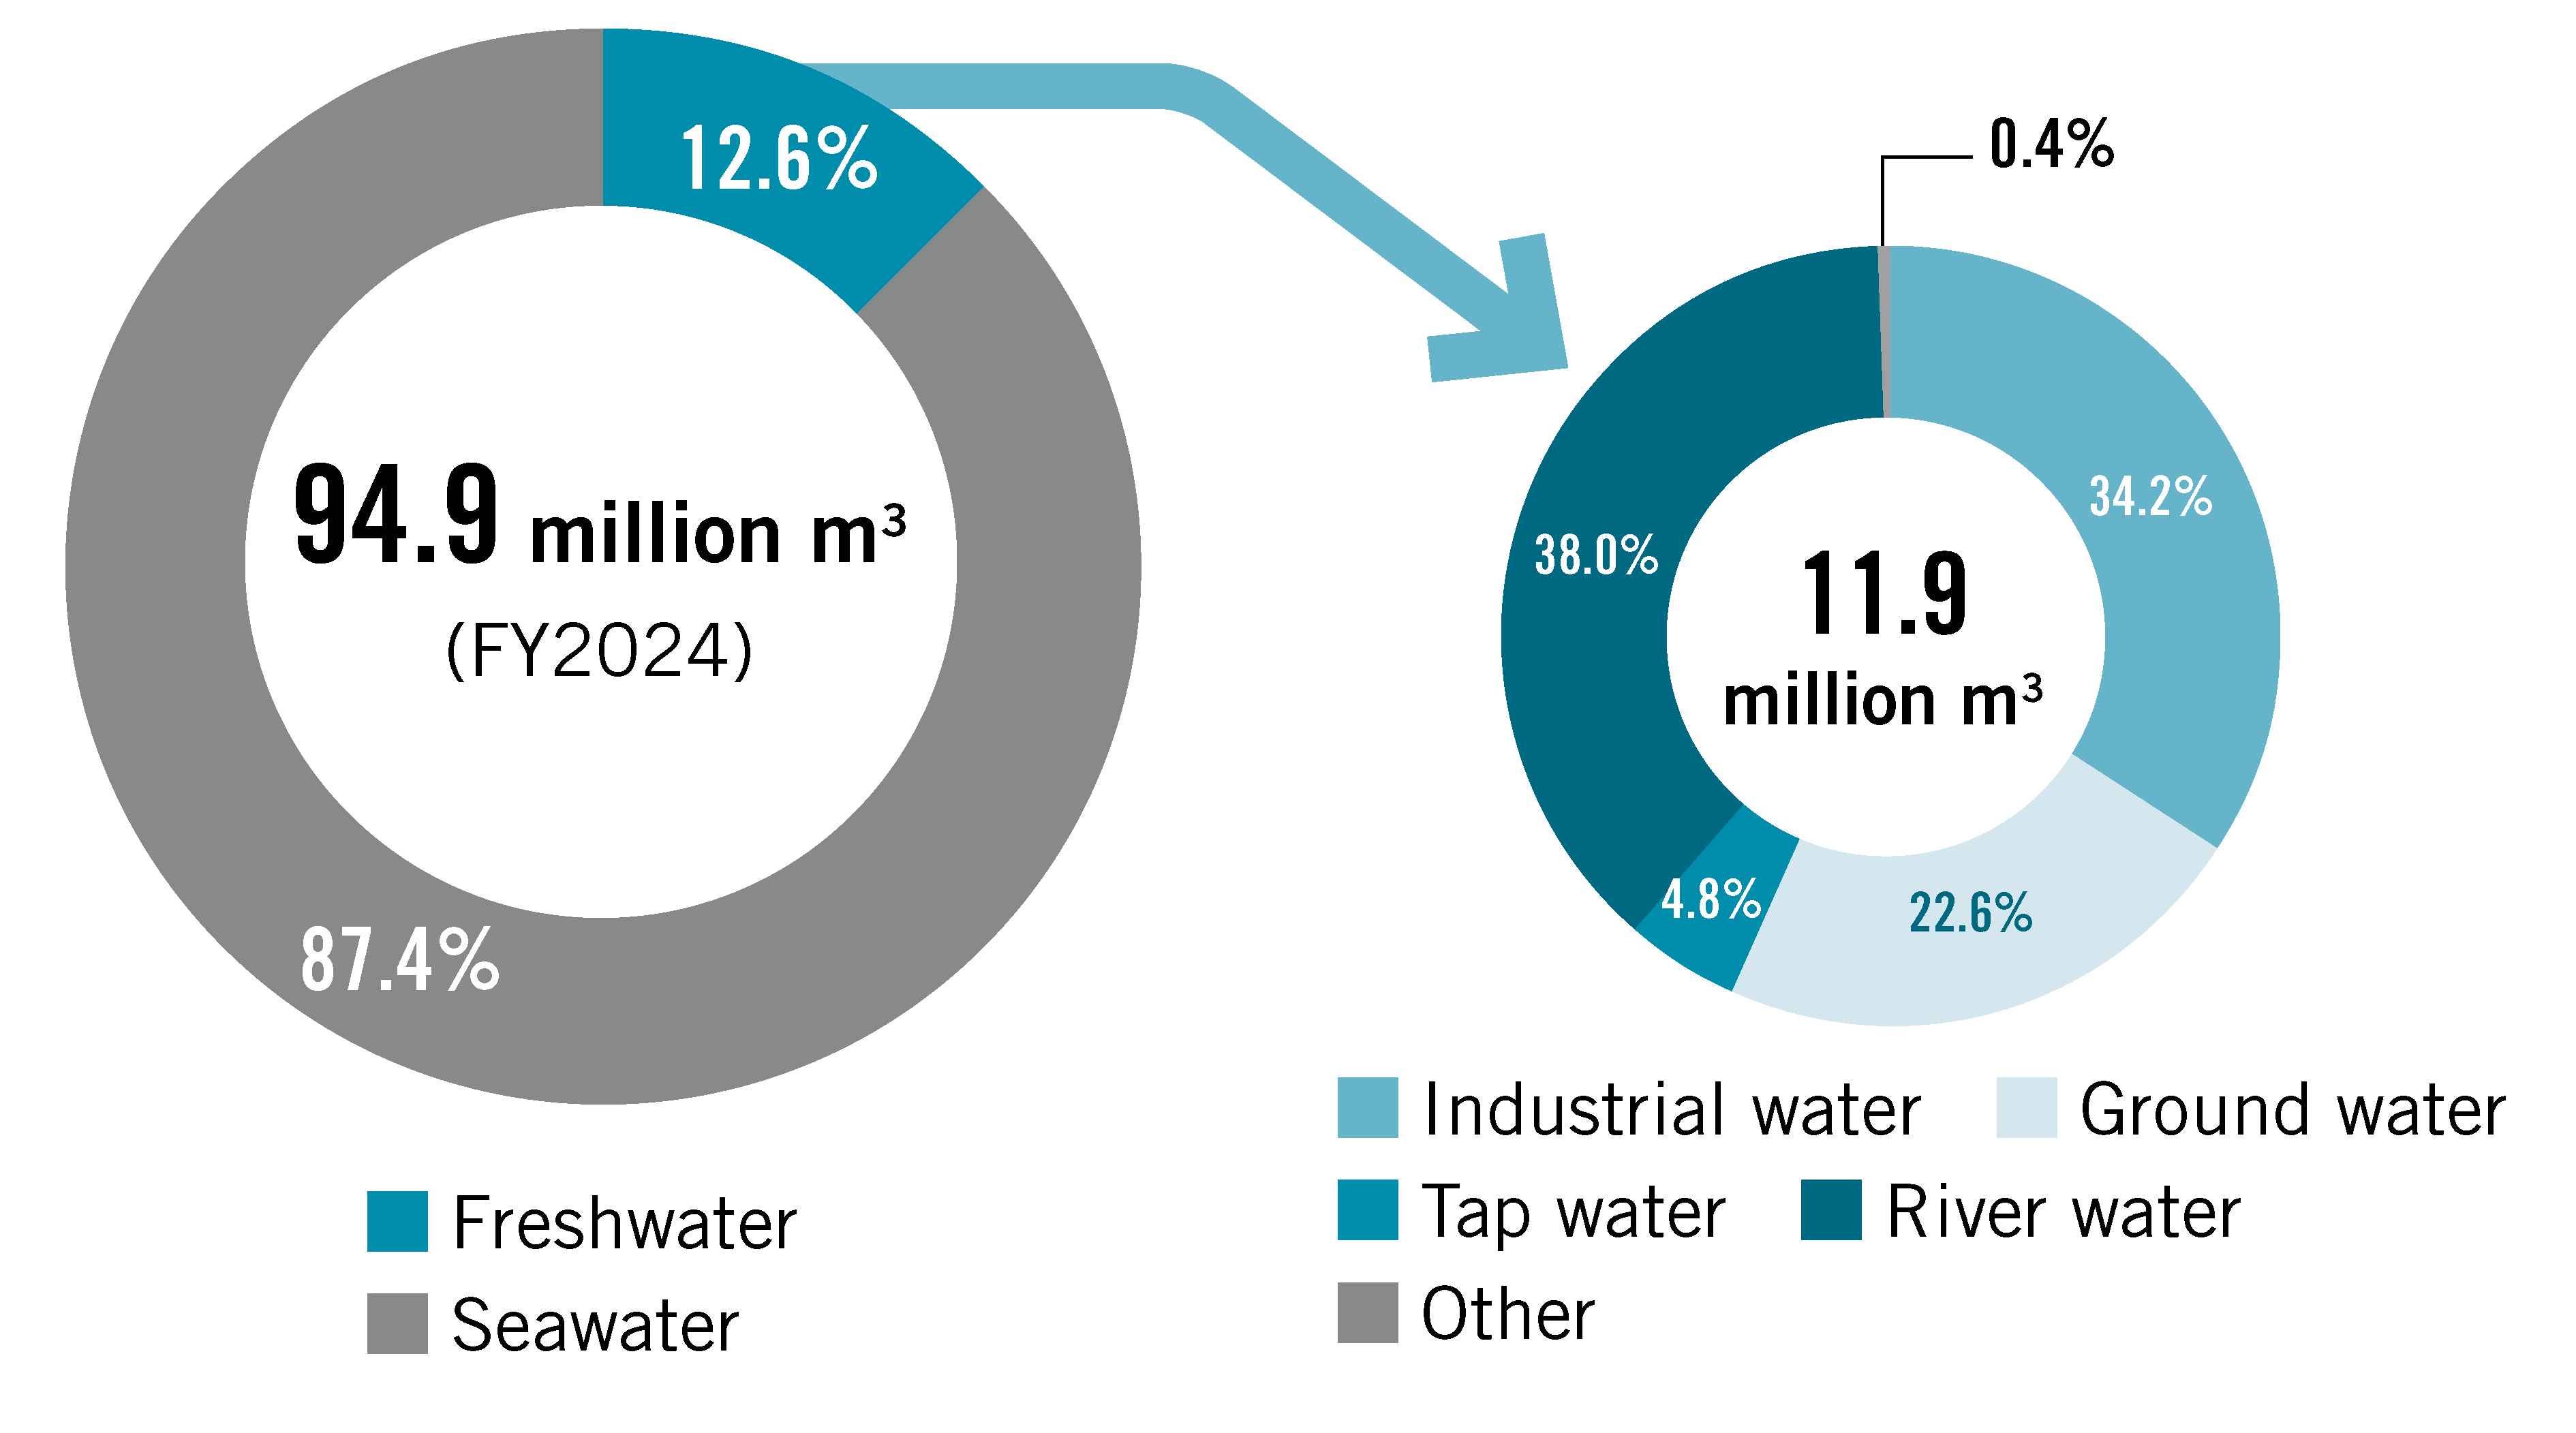
(Unit : Million m3)
|
Item |
FY2020 |
FY2021 |
FY2022 |
FY2023 |
FY2024 |
|
Purchased Water |
5.3 |
5.6 |
5.5 |
5.4 |
5.2 |
|
River Water |
4.6 |
4.6 |
4.2 |
4.5 |
4.0 |
|
Groundwater |
2.8 |
2.8 |
2.5 |
2.8 |
2.7 |
|
Other Water Sources |
0.03 |
0.02 |
0.04 |
0.04 |
0.05 |
|
Total |
12.7 |
13.1 |
12.1 |
12.8 |
11.9 |
The total amount of wastewater discharged in FY2024 was 93.3 million m³, a 5.0% decrease from the previous year.
In fiscal 2024, the Group’s GHG emissions (Scope 1 and 2) were 1,387 thousand tons of CO2, a decrease of 15.7% from the previous fiscal year. This decrease was mainly due to energy saving activities such as process improvement, decreases in GHG emissions through measures such as expansion of renewable energy usage, improvement of our electricity-derived emission factor (*), and revision of our waste emission factor. By source, fossil fuel-derived approximately 23%, waste-derived approximately 37%, and electricityderived accounted for approximately 39%.
(Unit : Thousand tons-CO2)
|
Item |
FY2020 |
FY2021 |
FY2022 |
FY2023 |
FY2024 |
|
|
Scope1 |
From fossil fuels |
312 |
324 |
311 |
322 |
324 |
|
From waste |
762 |
737 |
709 |
700 |
518 |
|
|
Scope2 |
From electricity |
681 |
638 |
659 |
624 |
545 |
|
Total CO2 emissions |
1,756 |
1,699 |
1,679 |
1,646 |
1,387 |
|
Note: Coverage of 90% or higher, location-based
(*) With regard to the electricity-derived emission factor used to calculate GHG emissions, the CO2 emission factor that has been used for domestic electricity thus far was the unadjusted provider-specific factor for the greenhouse gas calculation, reporting, and announcement system in accordance with the Act on Promotion of Global Warming Countermeasures (formerly the basic emissions factor). However, with the change in the system, this was changed to the providerspecific basic emissions factor (formerly the adjusted emissions factor). In line with this, we have recalculated emissions using the adjusted emissions factor, backdating to fiscal 2013, the baseline year for our reduction targets.
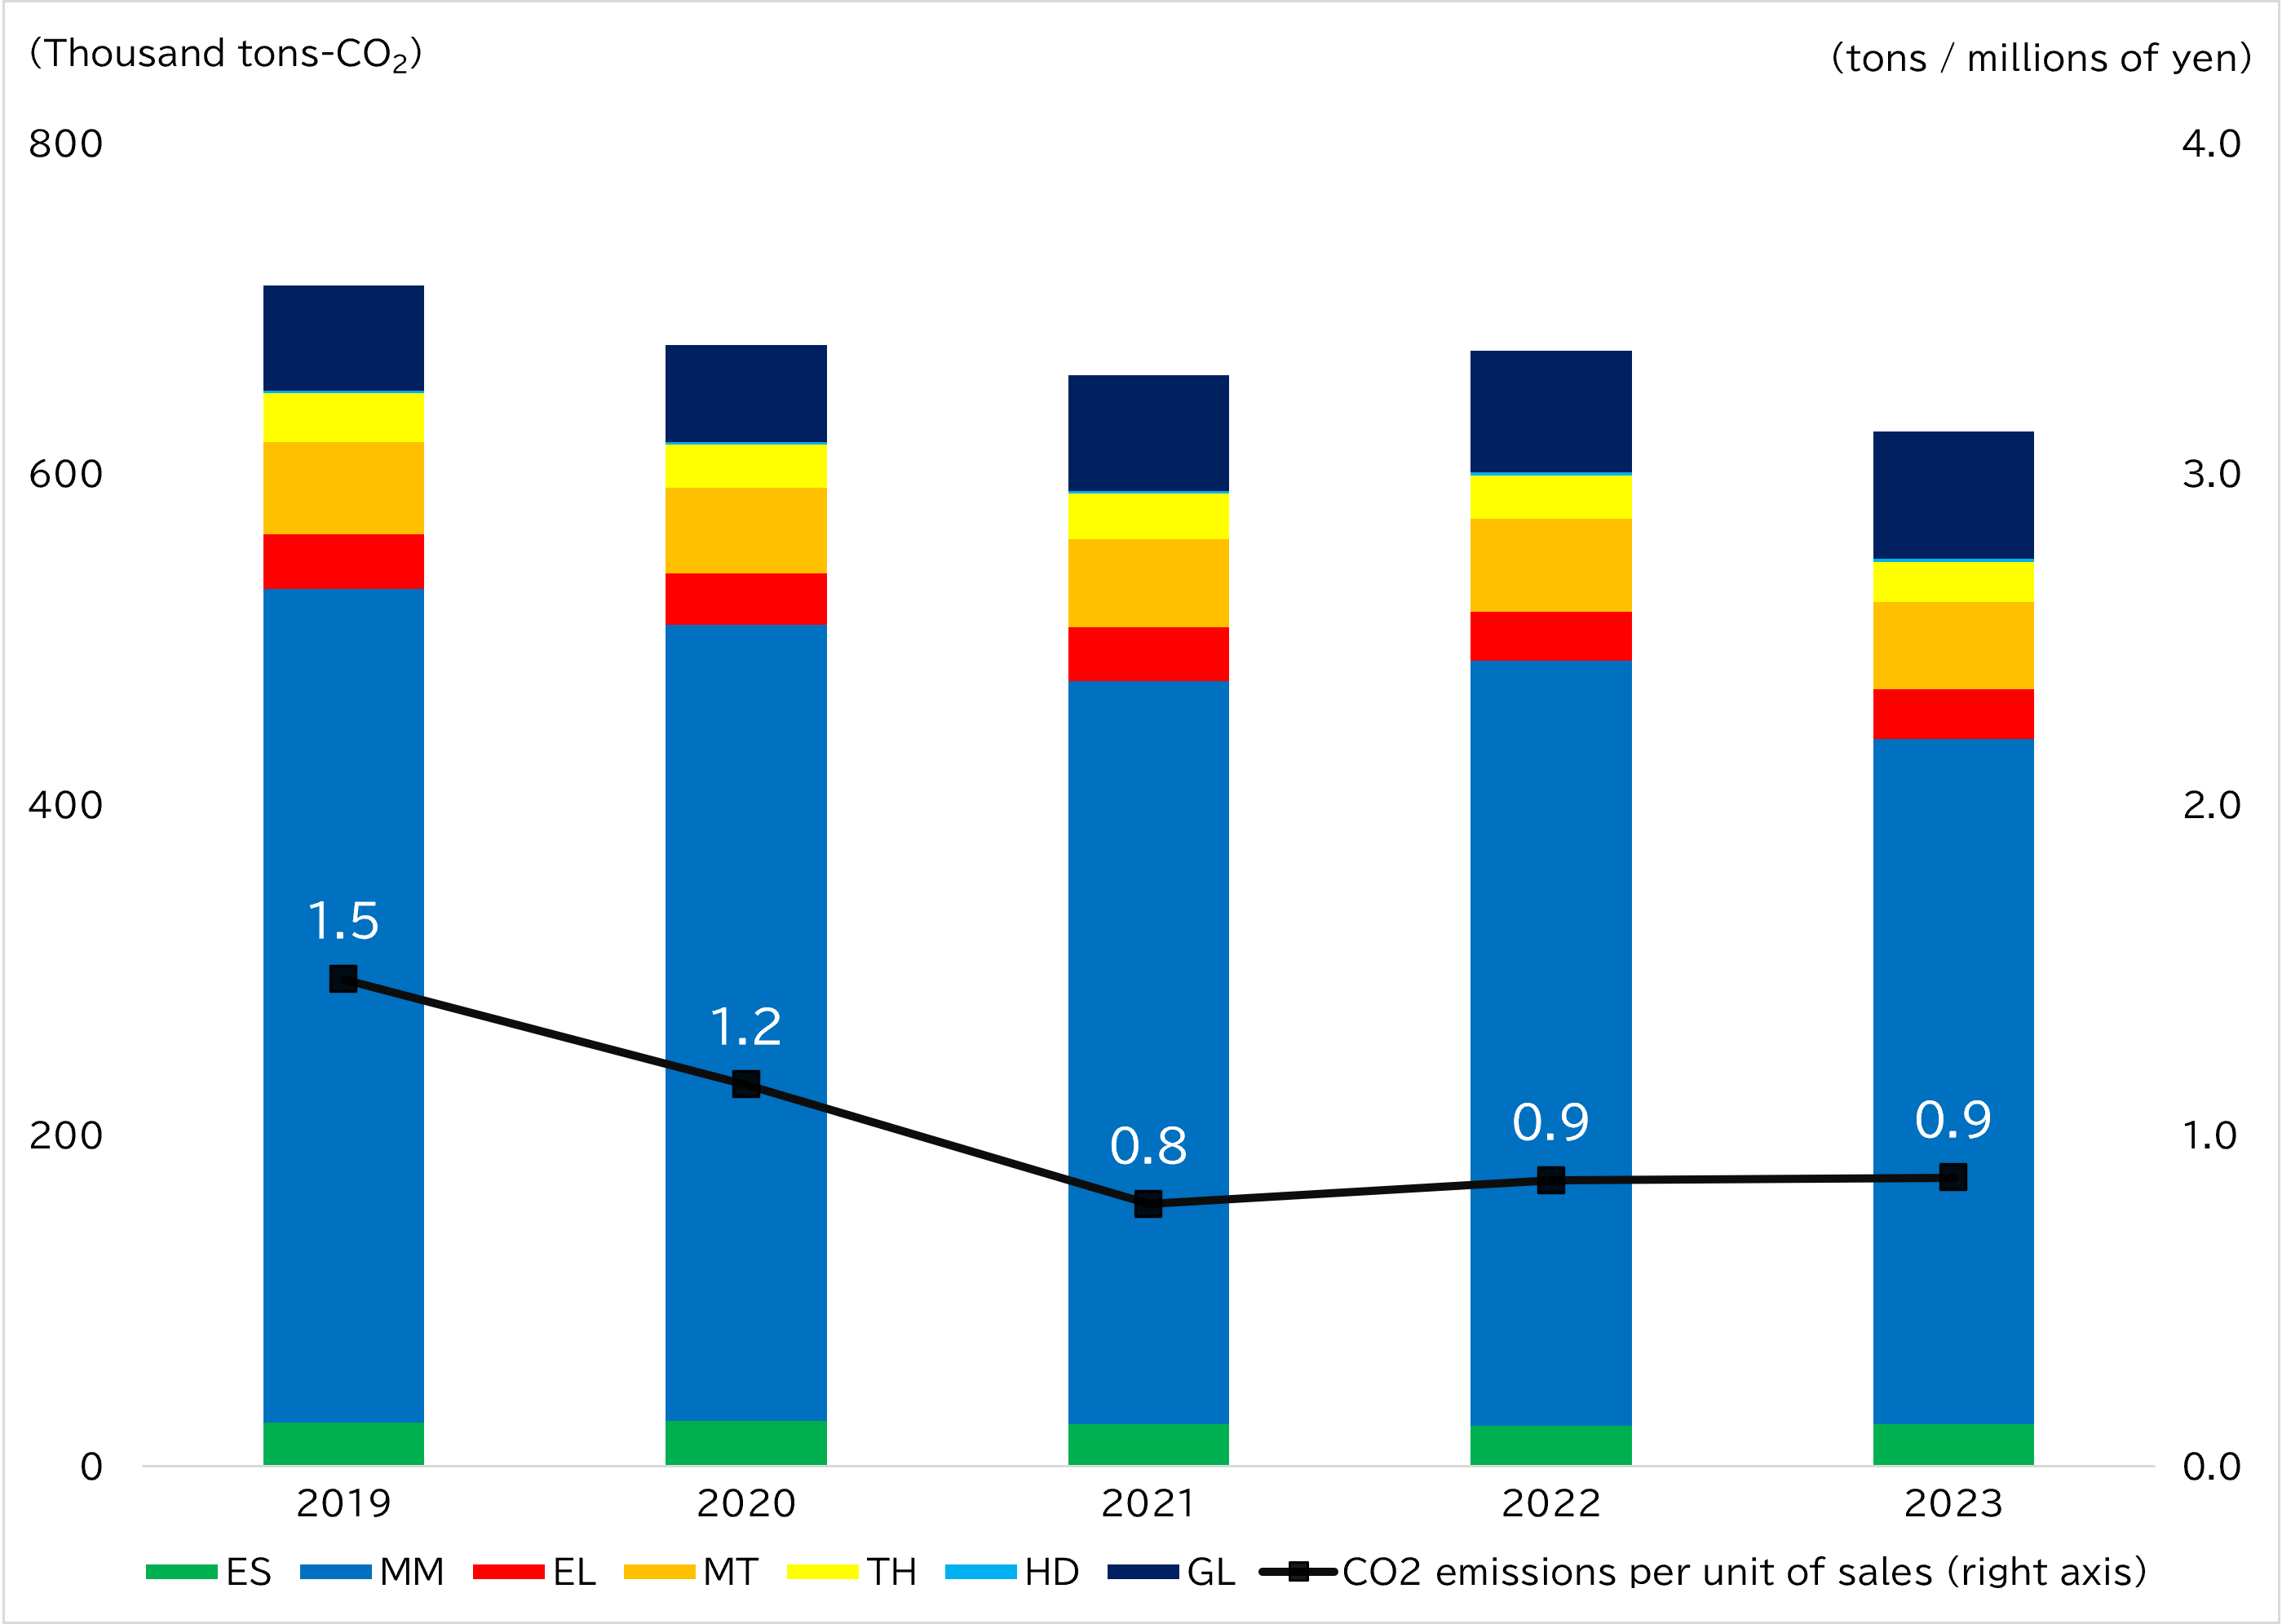
Note : Above figures use the following abbreviations.
HD: DOWA Holdings Co., Ltd.; ES: Environmental Management & Recycling Business; MM: Nonferrous Metals Business; EL: Electronic Materials Business; MT: Metal Processing Business; TH: Heat Treatment Business; GL: Global Business
The Group’s Scope 3 GHG emissions at its domestic business sites in fiscal year 2024 amounted to approximately 1,443 thousand t-CO₂.
By category, Category 1, “Purchased goods and services,” accounted for 59% of total Scope 3 emissions, while Category 4, “Upstream transportation and distribution,” accounted for 21%, representing a significant proportion of the total. Through its circular business model, the Group provides products and services to a wide range of markets and has established a diverse supply chain for raw materials and other inputs. As a result, the proportion of GHG emissions associated with the procurement of raw materials and materials is considered to be relatively high.
(Unit : Thousand tons-CO2)
|
Category |
Coverage |
FY2023 |
FY2024 |
|
|
1 |
Purchased goods and services |
Domestic |
767 |
846 |
|
2 |
Capital goods |
Consolidated total (Including overseas) |
139 |
164 |
|
3 |
Fuel- and energy-related activities |
Domestic |
119 |
120 |
|
4 |
Upstream transportation and distribution |
Domestic |
304 |
304 |
|
5 |
Waste generated in operations |
Domestic |
5 |
6 |
|
6 |
Business travel |
Domestic |
1 |
1 |
|
7 |
Employee commuting |
Domestic |
3 |
3 |
|
Total |
1,338 |
1,443 |
||
|
Scope 3 Calculation Method |
|
|
Category 1 |
Costs associated with the procurement of key raw materials and materials × Emission intensity |
|
Category 2 |
Capital investment amount × Emission intensity |
|
Category 3 |
Energy consumption × Emission intensity |
|
Category 4 |
Ton-kilometers by mode of transport (Our company and our upstream company are the shippers) × Emission intensity |
|
Category 5 |
Volume of waste disposed of outside the company × Emission intensity |
|
Category 6 |
Number of Employees × Emission intensity |
|
Category 7 |
Number of employees × Number of working days × Emission intensity (By type of workplace and city category) |
|
Category 8 to 15 |
Excluded (Category 8 : Included in Scope 1 & 2, Category 9 to 12 : Difficult to calculate due to the fact that we are in the materials industry and the diversity of product applications, Category 13 to 15:Excluded) |
|
Emission intensity |
Policy on Emissions Unit Values for Accounting of Greenhouse Gas Emissions, etc., by Organizations Throughout the Supply Chain (Ver.2.5) (*) |
(*) Published by Ministry of the Environment and Ministry of Economy, Trade and Industry (Government of Japan)
|
Unit |
FY2020 |
FY2021 |
FY2022 |
FY2023 |
FY2024 |
|
|
Hydroelectric power generation |
GWh |
74.7 |
72.8 |
68.8 |
61.9 |
41.8 |
|
Solar power generation |
MWh |
388.0 |
1,563.7 |
1,880.8 |
2,712.3 |
3,812.9 |
|
Biogas power generation |
MWh |
- |
901.5 |
2,267.0 |
3,376.0 |
4,187.9 |
|
Waste heat power generation |
GWh |
80.3 |
97.7 |
86.6 |
76.7 |
69.8 |
The amount of raw materials used in FY2024 was 939 thousand tons, representing a decrease of approximately 1.4% from the previous fiscal year. Of this total, about 19% consisted of recycled raw materials.
The amount of waste accepted in FY2024 was 1,726 thousand tons, which was almost unchanged from the previous fiscal year. Of this total, approximately 89% was waste received from external sources.
The volume of thermal recycling in fiscal year 2024 was 675 thousand tons, an increase of approximately 3% from the previous year.
The volume of material recycling was 296 thousand tons, an increase of approximately 7% from the previous year.
The volume of waste treatment in fiscal year 2024 was 384 thousand tons, a decrease of approximately 5% from the previous year.
The amount of waste discharged includes incineration residues and other byproducts generated after contracted treatment in our core waste management business.
(Unit : Thousand tons)
|
FY2020 |
FY2021 |
FY2022 |
FY2023 |
FY2024 |
||
|
Domestic |
371.2 |
376.5 |
375.4 |
384.9 |
365.0 |
|
|
Overseas |
46.1 |
17.9 |
13.0 |
18.4 |
18.6 |
|
|
Total |
417.3 |
394.4 |
388.4 |
403.4 |
383.6 |
|
|
Slag |
96.2 |
101.6 |
97.0 |
92.9 |
79.0 |
|
|
Hazardous waste (*) |
9.2 |
10.1 |
11.7 |
17.7 |
20.7 |
|
(*) It refers to waste as defined by the laws of each country. In Japan, it refers to specially controlled industrial waste.